
All modules
TV & Video
OTT Video Services
Track the entire digital video landscape by streaming platform, by access type and by market. Covers subscribers, users, revenues and ARPUs by platform and across free and paid services: from premium subscription to advertising-funded services, including ad-supported hybried tiers.
- 18 KPIs
- 1 488 actors
- 946 groups
- 200 countries
- 2022 – 2026
- Updated Quarterly, Yearly
- Forecasts No
- Years 2022 – 2026
Geographic coverage
-
SSA (Sub-Saharan Africa) 48 / 48 100%
-
French speaking Africa 20
Benin · Burkina Faso · Burundi · Cameroon · Central African Republic · Chad · Comoros · Congo · Democratic Republic of Congo · Djibouti · Gabon · Guinea · Ivory Coast · Madagascar · Mali · Mauritius · Niger · Senegal · Seychelles · Togo
-
English Speaking Africa 17
Botswana · Eswatini · Ghana · Kenya · Lesotho · Liberia · Malawi · Namibia · Nigeria · Rwanda · Sierra Leone · South Africa · Tanzania · The Gambia · Uganda · Zambia · Zimbabwe
-
Other SSA 9
Angola · Cape Verde · Equatorial Guinea · Eritrea · Ethiopia · Guinea-Bissau · Mozambique · Sao Tome and Principe · Somalia
-
Arab MENA 2
South Sudan · Sudan
-
-
Europe 47 / 71 66%
-
Central and Eastern Europe 21
Albania · Bosnia · Bulgaria · Croatia · Cyprus · Czech Republic · Estonia · Greece · Hungary · Kosovo · Latvia · Lithuania · Moldova · Montenegro · North Macedonia · Poland · Romania · Serbia · Slovakia · Slovenia · Ukraine
-
Western Europe 16
Andorra · Austria · Belgium · France · Germany · Gibraltar · Ireland · Italy · Liechtenstein · Luxembourg · Malta · Netherlands · Portugal · Spain · Switzerland · UK
-
Eurasian markets 5
Armenia · Azerbaijan · Belarus · Georgia · Russia
-
Nordics 5
Denmark · Finland · Iceland · Norway · Sweden
-
-
Latin America 44 / 47 94%
-
Caribbean Islands 24
Anguilla · Antigua & Barbuda · Aruba · Bahamas · Barbados · Bermuda · Bonaire (Netherlands) · British Virgin Islands · Cayman Islands · Curaçao · Dominica · Dominican Republic · Grenada · Haiti · Jamaica · Montserrat · Puerto Rico · Saint Kitts and Nevis · Saint Lucia · Sint-Maarten · St Vincent & the Grenad. · Trinidad and Tobago · Turks and Caicos Islands · US Virgin Islands
-
Other LATAM 8
Bolivia · Ecuador · Guyana · Paraguay · Peru · Suriname · Uruguay · Venezuela
-
Central America 7
Belize · Costa Rica · El Salvador · Guatemala · Honduras · Nicaragua · Panama
-
Latin America Top 5 5
Argentina · Brazil · Chile · Colombia · Mexico
-
-
Asia-Pacific 31 / 50 62%
-
Southeast Asia 10
Brunei · Cambodia · Indonesia · Laos · Malaysia · Myanmar · Philippines · Singapore · Thailand · Vietnam
-
SAARC 7
Bangladesh · Bhutan · India · Maldives · Nepal · Pakistan · Sri Lanka
-
East Asia 7
China · Hong-Kong (China) · Japan · Macau · Mongolia · South Korea · Taiwan
-
Eurasian markets 5
Kazakhstan · Kyrgyzstan · Tajikistan · Turkmenistan · Uzbekistan
-
Oceania 2
Australia · New Zealand
-
-
MENA 21 / 22 95%
-
Arab MENA 18
Algeria · Bahrain · Egypt · Iraq · Jordan · Kuwait · Lebanon · Libya · Mauritania · Morocco · Oman · Palestine · Qatar · Saudi Arabia · Syria · Tunisia · UAE · Yemen
-
Other MENA 3
Iran · Israel · Turkey
-
-
French Overseas 7 / 9 78%
-
French Overseas 7
Guadeloupe (France) · Guyane (France) · Martinique (France) · Mayotte (France) · New Caledonia (France) · Polynesia (France) · Reunion (France)
-
-
North America 2 / 2 100%
-
North America 2
Canada · USA
-
This workbook is available to Dataxis clients
Sign in to open it, or ask our team for access.
Request accessTRACKING
-
Reach and revenues by access, platform and country, with history and trends by market and by region. Quarterly data and history.
-
+180 countries, with market- and actor-level breakdowns.
-
Refreshed quarterly with historical series and trend tracking.
-
Online dashboard, Excel exports and API, plus analyst support.
DASHBOARD
What the dashboard looks like
-
01 / 03
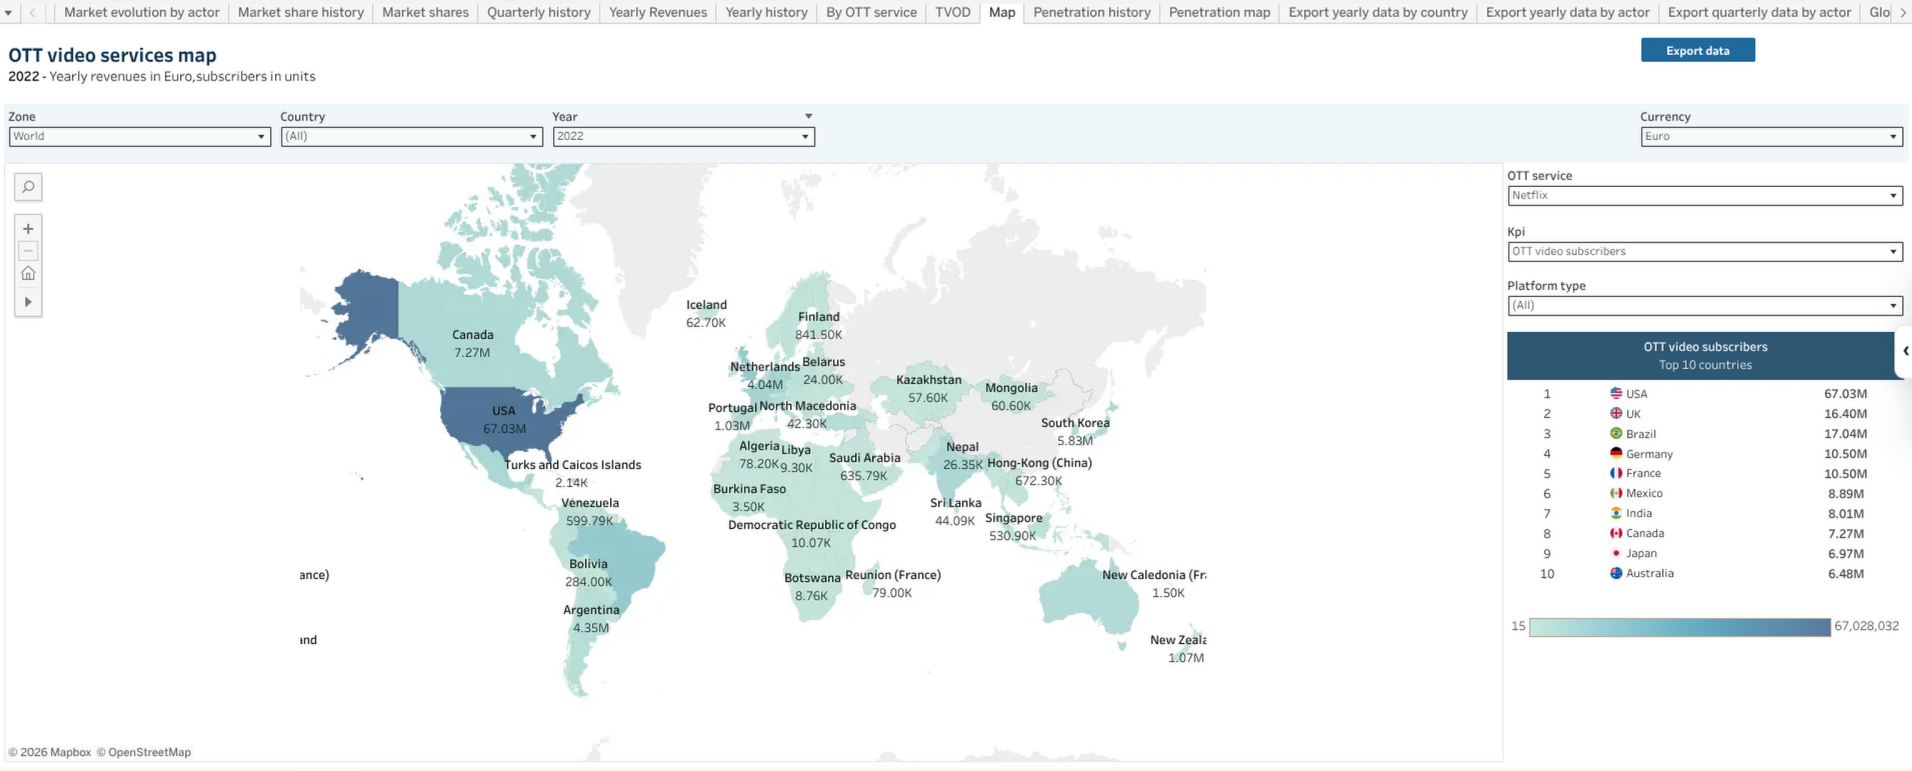
OTT video metrics by market. Evaluate your market landscape at a glance, then drill into specifics by operator, for every market and time period.
Kpis by actor and by region:
- Subscribers
- Monhtly Active Users
- Revenues
- Market shares
- ARPU
Split by
- Subscription model
- Advertising model
- Hybrid tiers
-
02 / 03
OTT video metrics by market. Evaluate your market landscape at a glance, then drill into specifics by operator, for every market and time period.
Kpis by actor and by region:
- Subscribers
- Monhtly Active Users
- Revenues
- Market shares
- ARPU
Split by
- Subscription model
- Advertising model
- Hybrid tiers
-
03 / 03
OTT video metrics by market. Evaluate your market landscape at a glance, then drill into specifics by operator, for every market and time period.
Kpis by actor and by region:
- Subscribers
- Monhtly Active Users
- Revenues
- Market shares
- ARPU
Split by
- Subscription model
- Advertising model
- Hybrid tiers


DIMENSIONS